2015 Alabama vs. past BCS national champions: A simulation
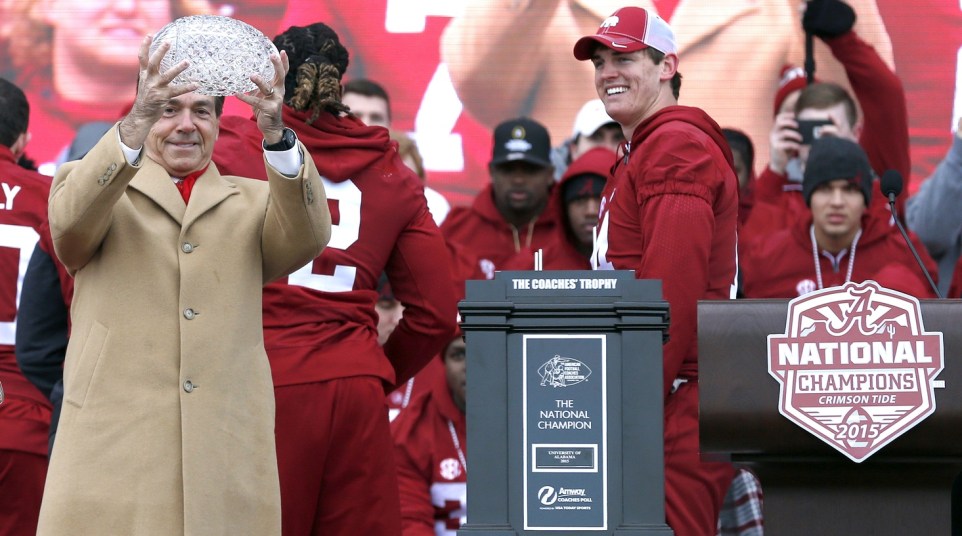
Alabama’s 45-40 victory over Clemson last month secured the Crimson Tide’s fourth national championship in the past seven seasons. Nick Saban’s 2015 squad had a great year, finishing 14-1 and winning by 13 points or more 12 times.
But where does this team rank among Saban’s national championship squads at both Bama and LSU? And where does it stand among the past 18 national champions?
The folks at foxsports.com used WhatIfSports.com’s college football simulation engine to play a round-robin tournament that included the 2015 Crimson Tide, the 2014 Ohio State team and every champion of the BCS era.
Here are some of the results:
The 2012 Alabama team captured the tournament by winning an impressive 84.8 percent of its games and held opponents to a simulation-best 12.1 points per matchup. With a 71.1 winning percentage, the 2011 Crimson Tide team finished a distant second.
What about the 2015 Bama squad? It placed ninth out of 18 teams, winning just 52.4 percent of its games. Three other Alabama squads (2012, 2011 and 2009) were among the eight teams that finished with a better winning percentage. Saban’s 2003 LSU team finished 12th, winning just 40 percent of its games.
Florida, Florida State, LSU and Ohio State, which each had two championship teams apiece, were the other schools with multiple entries in the tournament.
In case you were wondering, no team won fewer games than the 2010 Auburn Tigers. Led by Super Bowl 50 participant Cam Newton, the Gene Chizik-coached squad won just 20.1 percent of its matchups and surrendered a simulation-worst 29.1 points per game.
Here’s how the SEC champions from the past 18 seasons were ranked overall:
- No. 1: 2012 Alabama
- No. 2: 2011 Alabama
- No. 5: 2009 Alabama
- No. 7: 2008 Florida
- No. 9: 2015 Alabama
- No. 12: 2003 LSU
- No. 13: 2006 Florida
- No. 15: 1988 Tennessee
- No. 17: 2007 LSU
- No. 18: 2010 Auburn
You can see the full results of the WhatifSports.com’s tournament here.