Missouri looks for big leap from QB Drew Lock in second season
Is a recovery on its way?
Last year, Drew Lock looked overmatched. Last year, he looked too young. Last year, he looked like he had miles upon miles to go.
The numbers tell a story of hard lessons in a difficult year. Playing as the first true freshman to start for Missouri since Corby Jones in 1995, Lock completed 129 of 263 passes for 1,332 yards with four touchdowns and eight interceptions.
That production would never suffice in the Sun Belt, let alone the SEC.
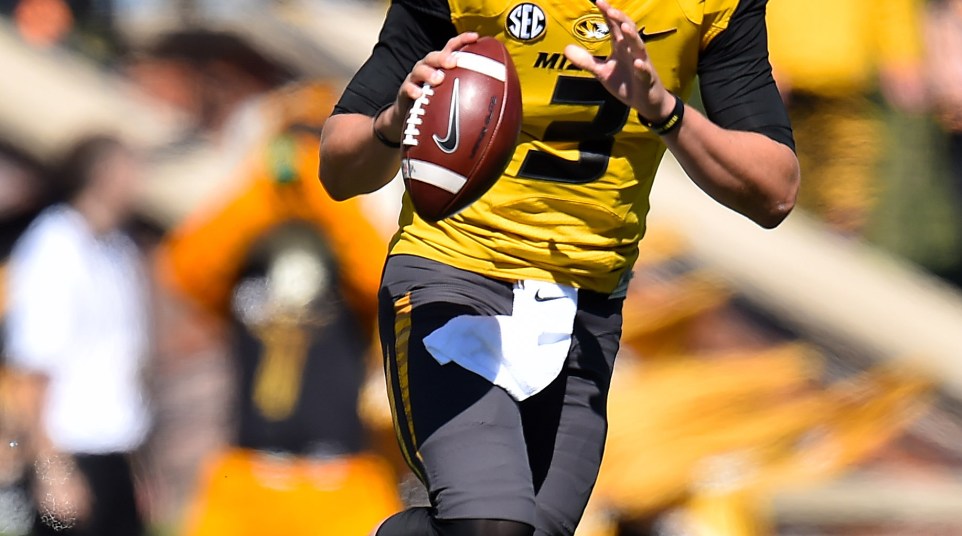
![Oct 17, 2015; Athens, GA, USA; Georgia Bulldogs linebacker Leonard Floyd (84) and linebacker Lorenzo Carter (7)] take down Missouri Tigers quarterback Drew Lock (3) during the second half at Sanford Stadium. Georgia defeated Missouri 9-6. Mandatory Credit: Dale Zanine-USA TODAY Sports](http://www.saturdaydownsouth.com/wp-content/uploads/2016/06/USATSI_8868194-1-610x407.jpg)
Credit: Dale Zanine-USA TODAY Sports
This season presents a chance for renewal. Lock must prove himself to coach Barry Odom and offensive coordinator Josh Heupel. Lock must show more confidence in the pocket. He must show that he has grown.
How have other recent Missouri starting quarterbacks fared in their second season compared to the first?
The results are mixed, but they’re worth revisiting to highlight the task before Lock. Different factors influenced the various signal-callers in their development. Still, each faced the same urgency to mature and guide the Tigers’ offense in an effective way.
Here’s a breakdown of how Missouri’s starting quarterbacks have performed in their second season compared to the first, beginning with Brad Smith in 2002.
BRAD SMITH
2002: 196-for-366 passing; 53.6 completion percentage; 2,333 yards; 15 TDs; 6 INTs
2003: 194-for-320 passing; 60.6 completion percentage; 1,822 yards; 11 TDs; 6 INTs
Analysis: Smith was an athletic marvel, so his passing numbers only tell part of the story. Yes, he had fewer completions, fewer pass attempts and fewer passing yards in 2003 compared to 2002. But he ran for 1,310 yards in 2003 compared to 1,029 the year before – an increase from 5.3 yards per carry his first year as a starter to a career-high 6.8 in 2003.
Given that Lock only ran for 28 yards on 52 carries last year, the chance of him becoming a reincarnation of Smith this season is about as good as Kansas warming to the idea of rekindling its rivalry with Missouri soon. Not going to happen.
CHASE DANIEL
2006: 287-for-452 passing; 63.5 completion percentage; 3,527 yards; 28 TDs; 10 INTs
2007: 384-for-563 passing; 68.2 completion percentage; 4,306 yards; 33 TDs; 11 INTs
Analysis: Daniel’s arm set the standard for the modern Missouri quarterback. His 4,306 yards in 2007 haven’t been matched since. No one has come close to his 33 touchdowns.
Daniel’s 2007 season, when he threw a whopping 563 times, is an outlier as much as Lock’s 2015 campaign likely will turn out to be. Still, there were signs before that fall big things were on the way for Daniel. He threw just 10 interceptions in 452 attempts in 2006, and his comfort behind center was obvious. It’s unlikely that Lock enters Daniel’s stratosphere this season.
BLAINE GABBERT
2009: 262-for-445 passing; 58.9 completion percentage; 3,593 yards; 24 TDs; 9 INTs
2010: 301-for-475 passing; 63.4 completion percentage; 3,186 yards; 16 TDs; 9 INTs
Analysis: Gabbert appeared Daniel-like in his first season as the starter. He surpassed Daniel’s first-year passing total with 3,593 yards. He also had one fewer interception and just four fewer touchdowns than Daniel totaled in 2006.
However, Gabbert declined in his second season, but in retrospect Missouri would love to have a 3,000-yard passer again. Gabbert and Daniel represent a different era of Missouri quarterback that likely won’t resurface soon. Lock’s troubles in his first season highlight how far the position has fallen since a dynamic run from 2006 to 2010.
JAMES FRANKLIN
2011: 238-for-376 passing; 63.3 completion percentage; 2,865 yards; 21 TDs; 11 INTs
2012: 139-for-234 passing; 59.4 completion percentage; 1,562 yards; 10 TDs; 7 INTs
Analysis: The steepest decline from the first season to the second is found here. Franklin threw for 1,303 fewer yards in 2012 compared to 2011, but he also played in four fewer games (nine). He was Missouri’s “bridge” quarterback between Big 12 and SEC play, and the Tigers’ struggle in their first SEC season is clear in Franklin’s 2012 stats.
Still, he recovered well to post 2,429 yards passing with 19 touchdowns in 2013 as Missouri won the SEC East for the first time. Franklin proved that a late-career revival is possible.
MATY MAUK
2013: 68-for-133 passing; 51.1 completion percentage; 1,071 yards, 11 TDs, 2 INTs
2014: 221-for-414 passing; 53.4 completion percentage; 2,648 yards; 25 TDs; 13 INTs
Analysis: It’s not worth reading much into Mauk’s numbers since off-the-field trouble cut short his career in 2015, with him playing in only four games. Still, he’s an example of promise squandered.

Credit: Mark Zerof-USA TODAY Sports
His 2,648 yards passing with 25 touchdowns in 2014 revealed his talent as he helped guide Missouri to a second consecutive division title. It’s interesting to consider what could have been with Mauk if he had stayed focus and developed in a healthy way.
The silver lining in his swift decline might be that Lock received ample experience as a true freshman. Time will show if something good will rise from a regrettable development.