Ad Disclosure

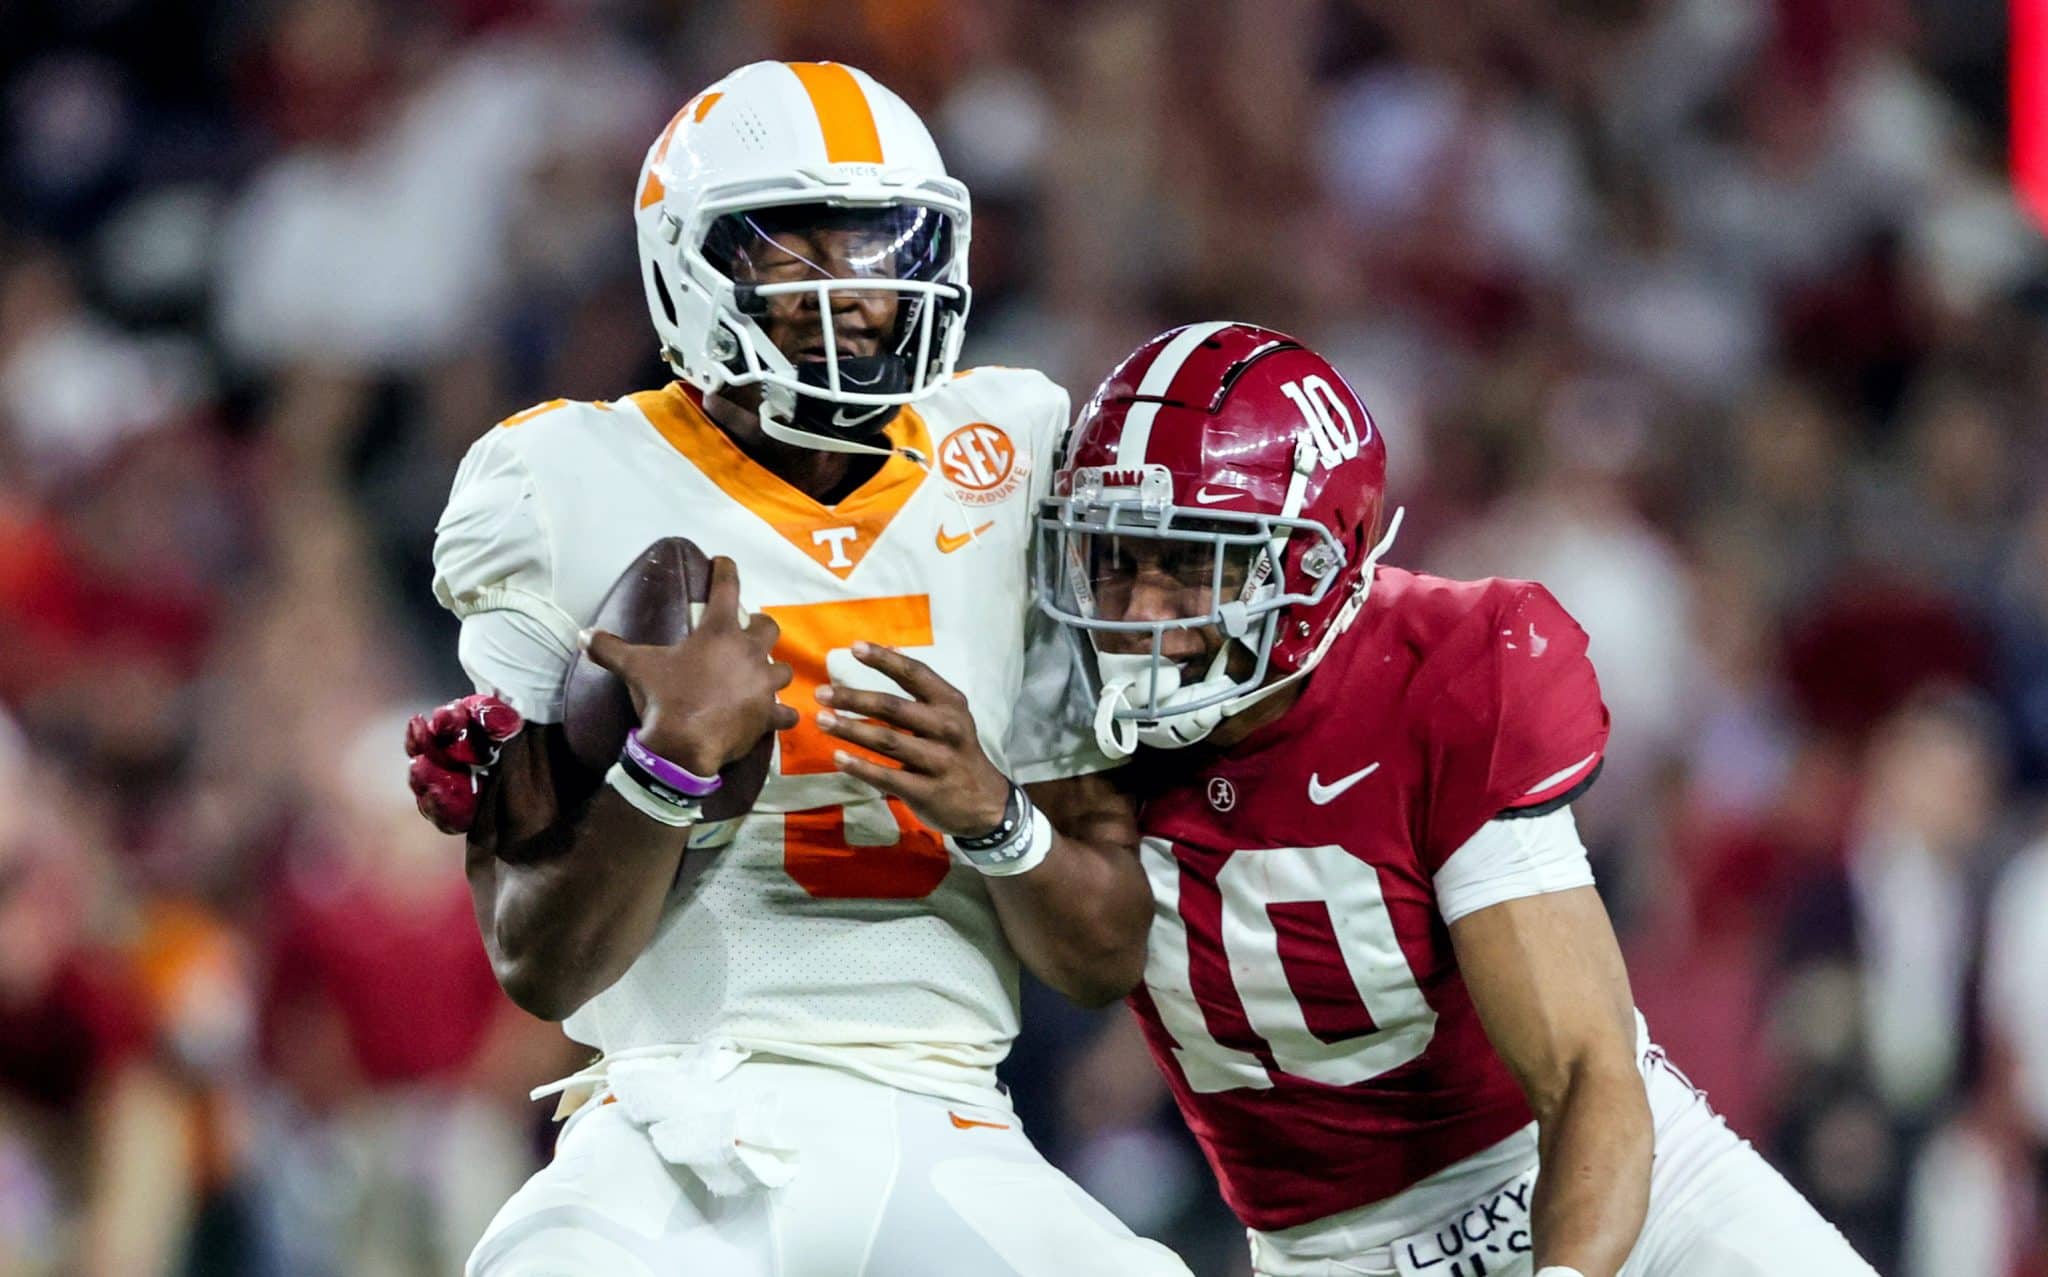
Alabama is set to host Tennessee this weekend in a pivotal Week 8 showdown in Tuscaloosa.
The Crimson Tide will be looking for revenge after the Vols defeated Alabama last season in Knoxville. Both teams enter this game with 1 loss on the season, making this a must-win game for both programs as they look to keep their College Football Playoff hopes alive.
Let’s examine some betting trends, advanced stats and other useful information about these two teams:
Alabama vs. Tennessee Betting Lines
Spread: Alabama -8.5 (DraftKings)
Total: Over/under 47.5 points (DraftKings)
- 1
- 2
- 3
- 4
- 5
- 6
Betting trends to know for Alabama
- Alabama is 4-3 against the spread this season
- The over is 4-2-1 in Alabama games this season
- Alabama is 17-12-1 in its last 30 games against the spread vs. SEC opponents
- Alabama is 5-2 against the spread in its last 7 games vs. Tennessee
- Alabama is 7-3 against the spread in its last 10 games prior to its bye week
- Alabama is 3-6-1 against the spread in its last 10 games as a favorite of 7 points or more
Betting trends to know for Tennessee
- Tennessee is 4-2 against the spread this season
- The under is 3-2-1 in Tennessee games this season
- Tennessee is 0-5 against the spread in its last 5 games as a road underdog of 7 points or more
- In the Josh Heupel era, Tennessee is 2-6 against the spread as an underdog
Most trends favor Alabama this week, although recently the Crimson Tide haven’t covered the spread as well as they used to in the Nick Saban era. While Alabama is covering at 17-12-1 in its last 30 games vs. SEC opponents, its cover percentage drops below .500 (4-5-1) when you only consider the last 10 games.
Josh Heupel has not been a profitable coach to bet on as an underdog during his time with the Vols. This is just the third time Tennessee has been a dog since the start of 2022, but this isn’t a spot Heupel has had much success in. However, there is one notable exception — 1 of Heupel’s 2 wins against the spread as an underdog came vs. Alabama last season when UT won outright.
Résumé rankings
Via ESPN’s Football Power Index:
- Alabama strength of schedule: 10th
- Tennessee strength of schedule: 88th
There’s a big gap between the schedules that Alabama and Tennessee have played so far this season, according to FPI. The Crimson Tide have faced a much tougher schedule, likely by virtue of its September meeting vs. Texas. The Tide have also faced Texas A&M and Ole Miss, both of whom are currently top-20 teams nationally according to FPI.
Tennessee’s schedule to this point in the season has been highlighted by a meeting with the Aggies at home. The Vols’ other SEC opponents so far — Florida and South Carolina — both rank outside of FPI’s top 30. Tennessee also played a very weak nonconference schedule — UTSA and No. 76 is the Vols’ highest-ranked nonconference opponent in FPI this week.
- Alabama strength of record: 5th
- Tennessee strength of record: 24th
Advanced Stats preview
Success rate will be the primary tool referenced in this section. Whether or not a play is “successful” depends on the down and distance of a given play. Here’s a breakdown of how much yardage is necessary for a play to be deemed “successful”:
- 1st down: Teams must gain at least 50% of required yardage
- 2nd down: Teams must gain at least 70% of required yardage
- 3rd or 4th down: Teams must gain 100% of required yardage
Defensively, numbers are presented as what the defense allowed the offense to achieve. So on defense, a 35% success rate is better than a 40% success rate.
Let’s dig into what success rate says about this matchup:
Rushing Success Rate
- Alabama rushing offense success rate: 43% (52nd percentile)
- Tennessee rushing defense success rate: 32% (96th percentile)
Tennessee’s rush defense has been dominant on a down-to-down basis so far this season. That checks out with the raw stats as well — the Vols rank 11th nationally in rushing yards per carry allowed with 2.98 yards.
On the other side, Alabama’s running game has not been up to its usual standard in 2023. The Tide have a mediocre success rate on the ground, which has caused them to be in passing-down situations 35% of the time so far this season (that ranks in the 13th percentile nationally).
- Tennessee rushing offense success rate: 48% (79th percentile)
- Alabama rushing defense success rate: 32% (94th percentile)
No major takeaways on this side of the matchup. Alabama’s rush defense is a major strength and the Vols have been efficient in that area as well so far this season.
Passing Success Rate
- Alabama passing offense success rate: 41% (46th percentile)
- Tennessee passing defense success rate: 35% (90th percentile)
This isn’t exactly breaking news, but Alabama’s passing offense has left quite a bit to be desired this season. The Tide’s numbers are likely being dragged down a little bit by the South Florida game, but it’s still a weakness the Tide will have to contend with vs. Tennessee.
Tennessee’s passing defense has been excellent so far this season. The Vols have only given up 4 passing touchdowns all year. They’ve also yielded just 43 passing plays of 10+ yards so far this season, which is the best mark in the SEC entering Week 8.
- Tennessee passing offense success rate: 43% (54th percentile)
- Alabama pass defense success rate: 32% (99th percentile)
For all of Alabama’s struggles in the passing game, Tennessee has had consistency issues of its own with Joe Milton. The Vols are similarly-mediocre on that end and are probably better off running the ball if possible.
Alabama’s pass defense is elite on a down-to-down basis. The Tide have been a little bit vulnerable to the big play — they’ve given up 12 passes of 30+ yards, which is tied for 11th in the SEC. It will be interesting to see if Milton can hit a deep ball at some point on Alabama’s secondary.
Havoc rate
A havoc play is defined as a play where the defense records a tackle for loss, a forced fumble, an interception or a pass breakup.
For defenses, a higher havoc rate is good. Offensively, havoc rates are presented as what the offense allowed the defense to create. On that side of the ball, the lower the havoc rate, the better it is for your offense.
Here’s a breakdown of this matchup:
- Alabama offensive havoc rate: 17% (38th percentile)
- Tennessee defensive havoc rate: 20% (85th percentile)
We have our first major mismatch here. Tennessee’s defensive havoc rate is borderline elite while Alabama has been vulnerable in that area so far this season.
A word of caution: Remember the large disparity in strength-of-schedule ratings between these programs? It’s entirely possible that what appears to be a sizable advantage for the Vols is just a product of Tennessee’s easier schedule to this point in the season.
- Alabama defensive havoc rate: 19% (80th percentile)
- Tennessee offensive havoc rate: 14% (75th percentile)
On this side of the ball, things appear to be much more even in the havoc department.
Points per opportunity
A scoring “opportunity” is defined as a possession in which the offense has moved the ball beyond the opponents’ 40-yard line. This stat measures how effective a team is at cashing on its scoring chances — or preventing them from their opponents.
- Alabama points scored per opportunity: 4.31 (67th percentile)
- Tennessee points allowed per opportunity: 2.81 (88th percentile)
On this side of the ball, both Alabama’s offense and Tennessee’s defense are fairly efficient. The Vols have been a bit better in these situations, albeit against a lighter schedule.
- Tennessee points scored per opportunity: 3.64 (36th percentile)
- Alabama points allowed per opportunity: 3.47 (62nd percentile)
Tennessee’s offense has not been good enough at converting scoring opportunities this season. The Vols have been subpar in the red zone and on 4th down so far this year. It’s possible that some positive regression is coming for Tennessee in those spots.
Tracking efficiency
- Alabama offense: 39th
- Alabama defense: 7th
- Alabama special teams: 20th
- Tennessee offense: 46th
- Tennessee defense: 11th
- Tennessee special teams: 71st
- Alabama offense: 19th
- Alabama defense: 6th
- Alabama special teams: 8th
- Tennessee offense: 18th
- Tennessee defense: 15th
- Tennessee special teams: 64th
Note: All advanced stats mentioned in this story are from CollegeFootballData.com unless otherwise noted. Betting trends are via the Sports Betting Dime database.
Spenser is a news editor for Saturday Down South and covers college football across all Saturday Football brands.


