Ranked No. 1 and undefeated at 8-0, Alabama is looking strong after passing four major SEC tests (sorry, Kentucky) and two remaining (apologies this time to Mississippi State, which coincidentally just lost to Kentucky).
In every game this season, Alabama took the lead into halftime except against Ole Miss. The Crimson Tide’s first true road game was an exercise in resolve — being able to come back and hold on to the lead. However, the first half has been decisive in seven other games. Let’s take a look at the 10 most impressive first half stats.
-Opponents’ pass completion rate. At first glance, one might think it’s just a product of being successful while opposing teams attempt to come from behind, but a close look shows this isn’t the case. Alabama’s opponents have thrown 132 passes in the first half and 131 passes in the second half, so the attempts are nearly identical. However, the completion rate is 49.2 percent in the first half compared to 57.3 percent in the second half.
-This is borderline cheating, but it’s important to also include opposing quarterbacks’ ratings. In the first half, opposing quarterbacks have registered an average quarterback rating of 100 while in the second half quarterbacks average a rating of 121.4. That is a significant difference.
-Statistically, Alabama quarterbacks are actually much better in the second half. However, in terms of passing attempts, they have thrown far more passes during the first half. Alabama quarterbacks have thrown 147 pass attempts in the first half while throwing just 86 pass attempts in the second half. That’s mostly attributed to playing with the lead.
-Josh Jacobs has definitely performed better in the first half. Jacobs has 336 rushing yards in the first half with an 8.4 yards per carry average. In the second half, he has just 45 rushing yards with 3.5 yards per carry. Jacobs also has three first half touchdowns compared to zero in the second half.
-On the whole, O.J. Howard has been a more reliable target during the first half. Howard has 16 catches in the first half compared to just six in the second half. He has 179 yards receiving and 2 TDs in the first half compared to 99 yards and no TDs after the break.
–64. That is the number of total yards that Kent State’s offense gained against Alabama during the Crimson Tide’s shutout win.
-74. That is the number of total yards an SEC team (Kentucky) accumulated against Alabama during the Crimson Tide’s 34-6 win.
-13-0. The difference between Alabama and Kent State during the first half based on special teams alone. Alabama was 2-for-2 on field goals. Also, Xavian Marks returned a punt 75 yards for a touchdown and Kent State missed a field goal. Technically, that doesn’t count extra points, generally designated a special teams scoring opportunity (the scoring differential goes up to 18-0 if extra points are taken into consideration).
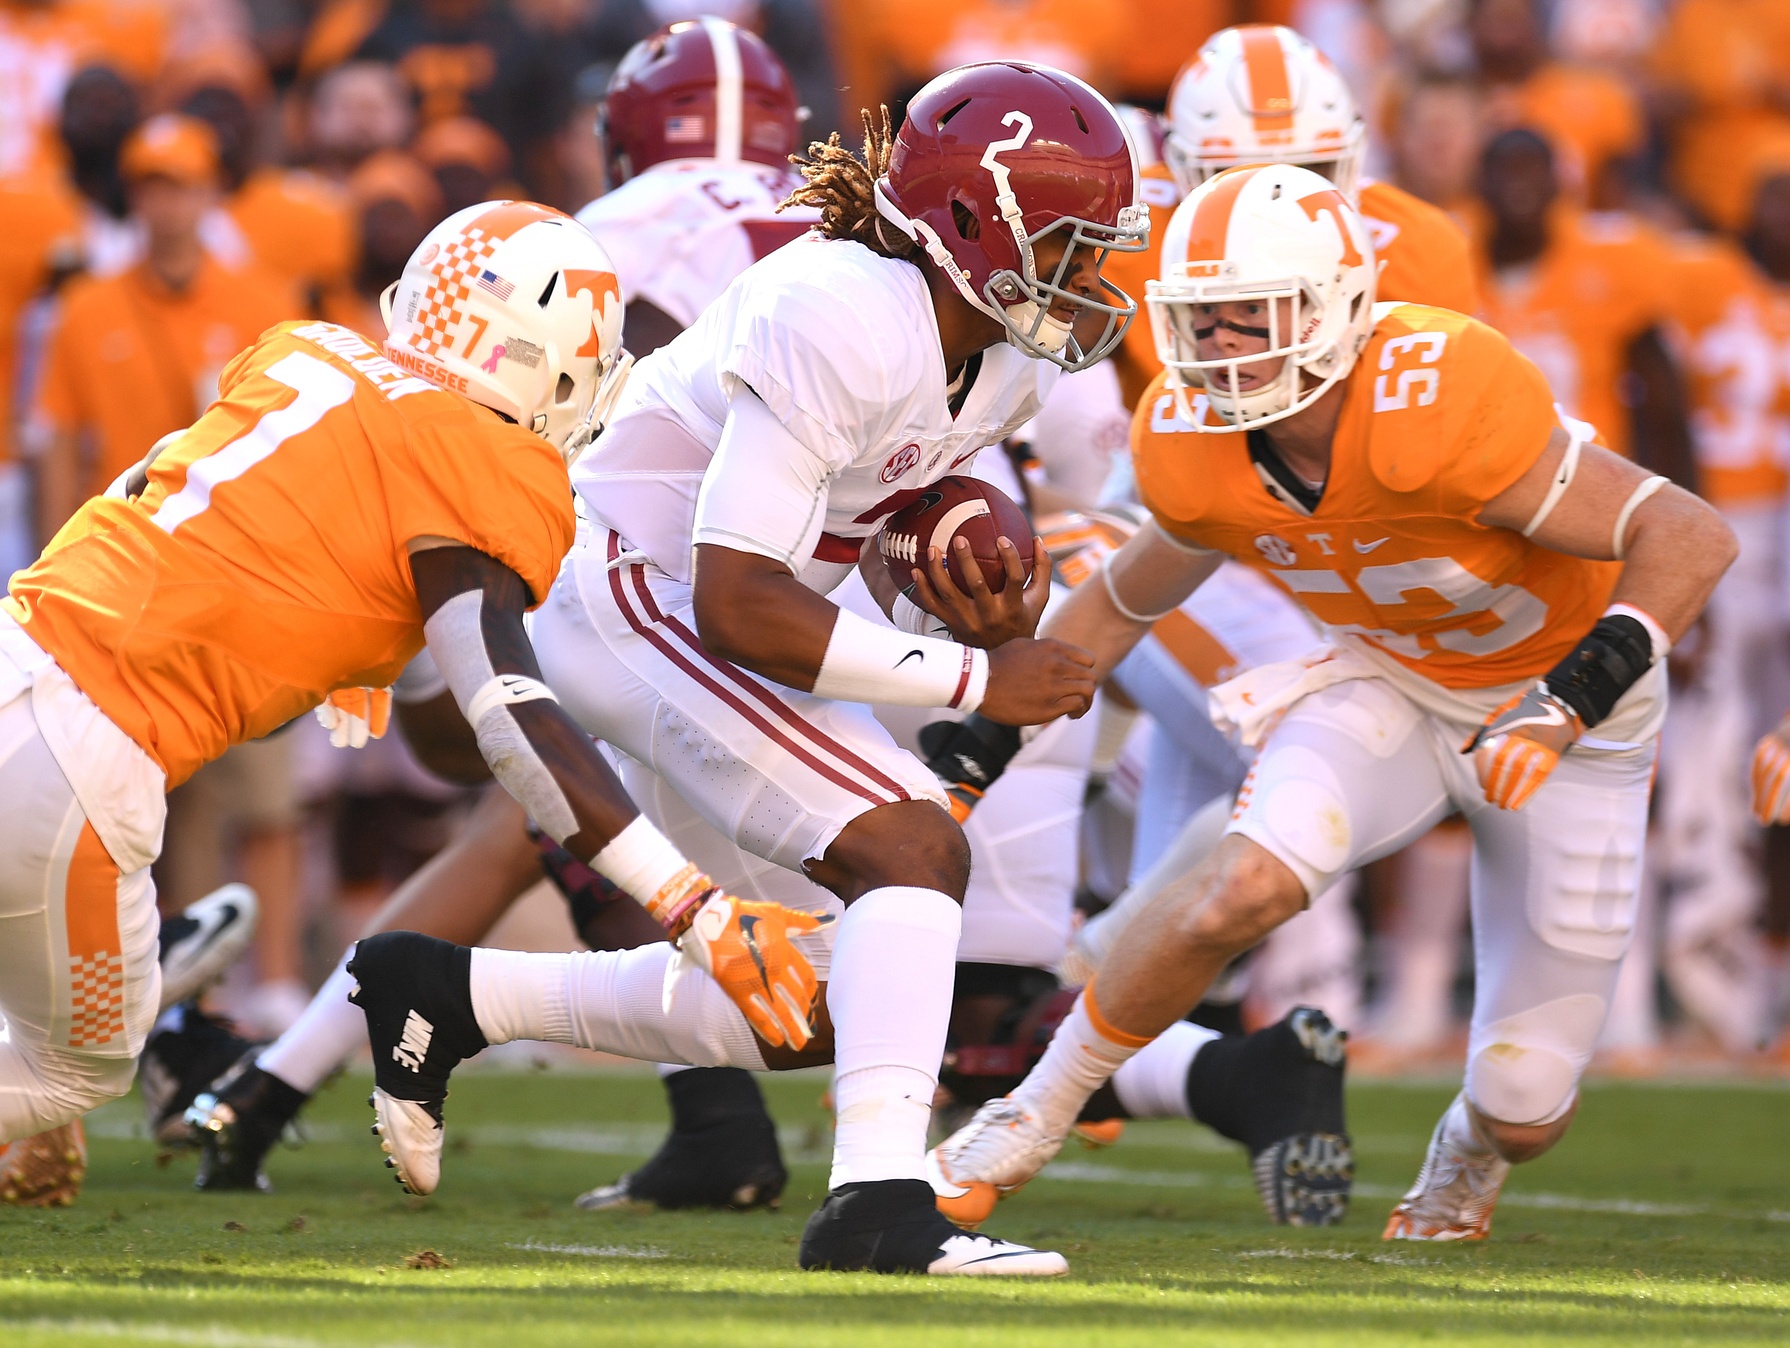
-20 percent. Tennessee’s third down percentage during the first half against Alabama (2-for-10). Tennessee punted multiple times in the first half because Josh Dobbs was either sacked or threw rushed incompletions.
-85 yards. Eddie Jackson scored the longest special teams score of the season thus far with a punt return touchdown right before halftime at Ole Miss. Even though Jonathan Allen’s defensive touchdown in the second half was perhaps more impressive, Allen’s touchdown spanned 10 fewer yards.