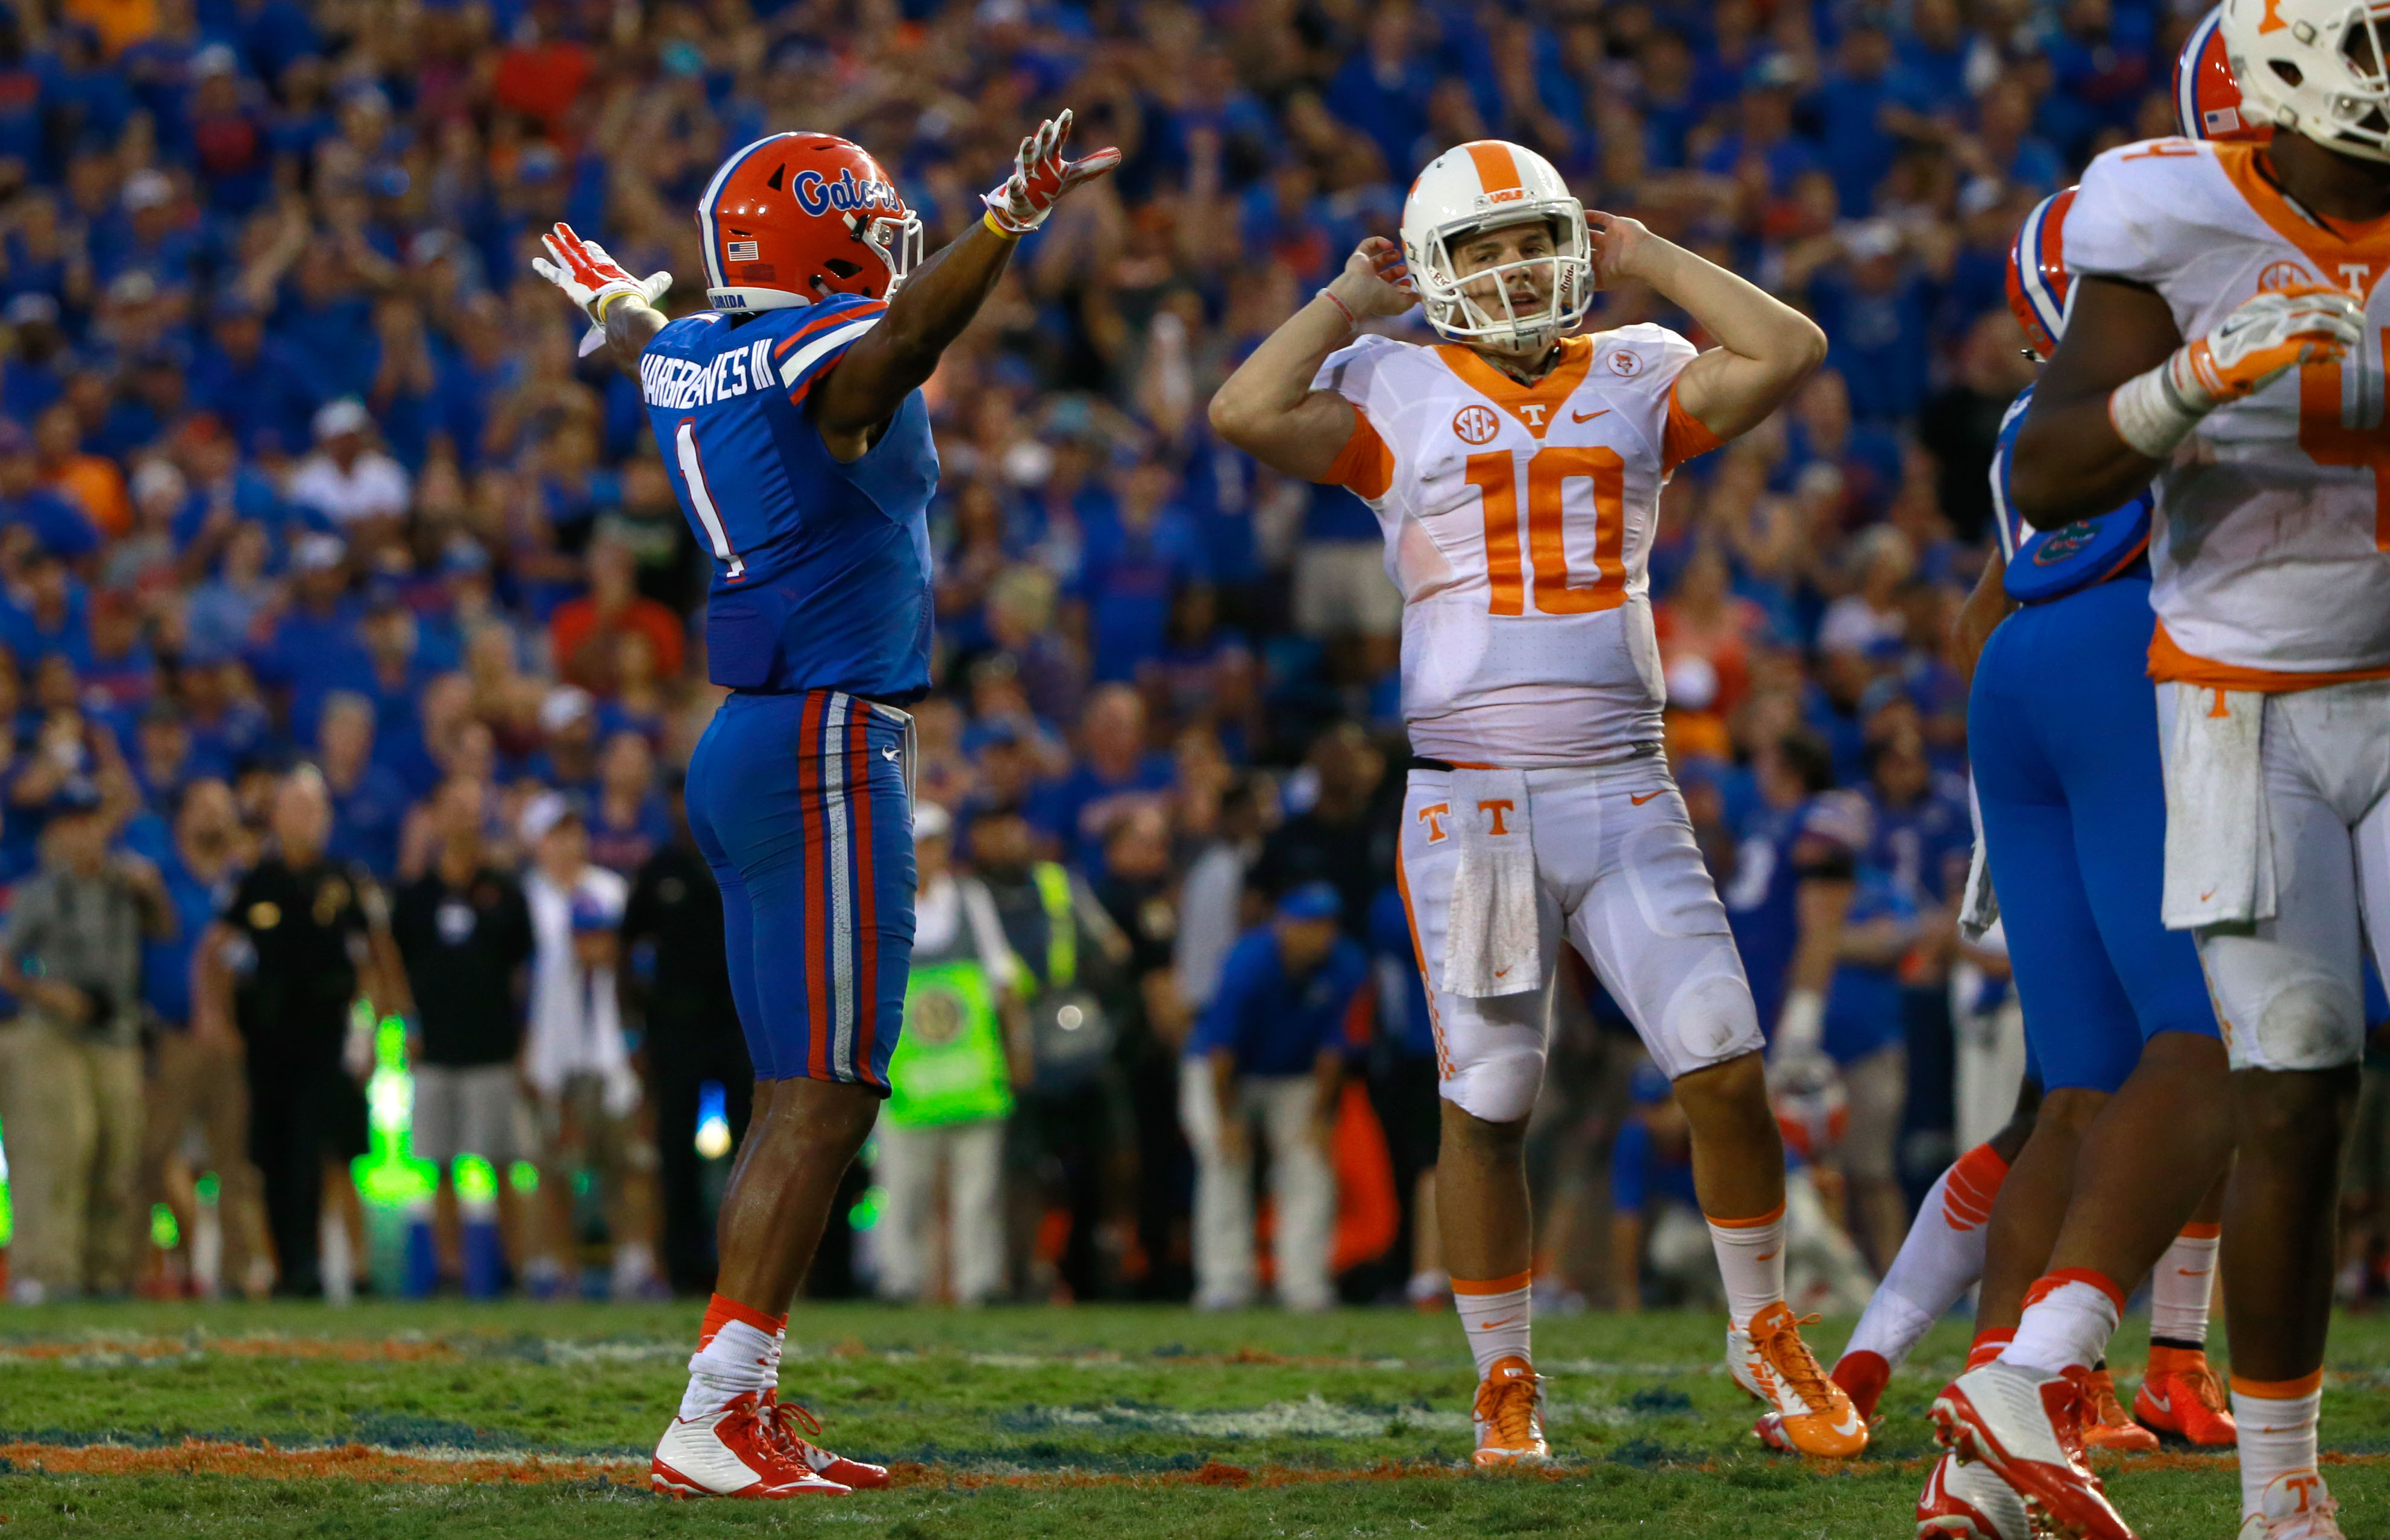
KNOXVILLE, Tenn. — It’s been a long 11 years.
That’s how many consecutive years Tennessee has lost to the Gators. There have been a wide range of ways in which Florida has pulled out a victory during the current winning steak.
From the blowout wins under Urban Meyer, to the past two one-point victories over Butch Jones’ teams, Florida has put together a streak that might never be duplicated again in the series.
The current 11-game streak has seen Phillip Fulmer lose after attempting a fake punt, Tim Tebow convert a 4th-and-1 to help ice a comeback victory and Cam Newton score a touchdown in garbage time in a blowout win.
Lane Kiffin wanted to sing Rocky Top after beating the Gators — but wound up on the losing end to Meyer. Derek Dooley lost a halftime lead in his final season. Jones has been right there, only to lose two one-point heart-breakers in as many years.
The average score in the current 11-game streak is Florida 29 Tennessee 16.3, and during the streak there have been three 1-point wins for Florida (2006, 2014, 2015) and the Gators have won three contests by more than two possessions (2007, 2008, 2012).
Florida has won the turnover battle every year except for 2009, 2014 and 2015 — when it was even; Tennessee has never had fewer turnovers in 11 years. Oddly enough, Tennessee has had fewer penalties in the 11 games in all but three games (2010, 2012, 2014).
Florida has had the most rushing yards in every game since 2005 except for last season when Tennessee outrushed the Gators 254 yards to 109 yards. The only other time Tennessee has rushed for 100 yards was in Kiffin’s 2009 season.
Florida has had more first downs than Tennessee in every contest except in 2005, 2011 and 2015. Remarkably, Tennessee has been a better passing team than Florida during the streak, having more passing yards in six games (2006, 2008, 2010, 2011, 2012, and 2014).
Not that Vols fans want one, but here’s a refresher on some of the key stats that have determined each of the past 11 losses to Florida. They provide clues on what needs to change Saturday inside Neyland Stadium.
2005 Florida 16 Tennessee 7
Stat TENN FLA
First Downs 14 13
Rush-Yds-TDs 25-66-0 37-68-1
Comp-Att-Yd-TD-INT 16-35-147-1-0 17-26-179-0-0
Total Yards 213 247
Fumbles-Lost 2-1 2-0
Turnovers 1 0
Penalties-Yards 4-20 10-63
2006 Florida 21 Tennessee 20
Stat FLA TENN
First Downs 22 13
Rush-Yds-TDs 41-121-0 23–11-1
Comp-Att-Yd-TD-INT 15-25-199-3-1 18-33-231-1-2
Total Yards 320 220
Fumbles-Lost 0-0 0-0
Turnovers 1 2
Penalties-Yards 9-65 4-34
2007 Florida 59 Tennessee 20
Stat TENN FLA
First Downs 14 23
Rush-Yds-TDs 21-37-0 46-255-4
Comp-Att-Yd-TD-INT 28-46-261-1-2 14-19-299-2-1
Total Yards 298 554
Fumbles-Lost 2-1 0-0
Turnovers 3 1
Penalties-Yards 7-40 9-66
2008 Florida 30 Tennessee 6
Stat FLA TENN
First Downs 16 16
Rush-Yds-TDs 39-147-0 31-96-1
Comp-Att-Yd-TD-INT 8-15-96-2-0 18-28-162-0-1
Total Yards 243 258
Fumbles-Lost 0-0 2-2
Turnovers 0 3
Penalties-Yards 9-57 9-95
2009 Florida 23 Tennessee 13
Stat TENN FLA
First Downs 13 20
Rush-Yds-TDs 32-117-1 44-208-2
Comp-Att-Yd-TD-INT 11-19-93-0-2 14-19-115-0-1
Total Yards 210 323
Fumbles-Lost 1-0 1-1
Turnovers 2 2
Penalties-Yards 3-40 4-25
2010 Florida 31 Tennessee 17
Stat FLA TENN
First Downs 18 11
Rush-Yds-TDs 49-150-3 23-29-0
Comp-Att-Yd-TD-INT 14-23-167-1-0 19-31-259-2-2
Total Yards 317 288
Fumbles-Lost 4-2 1-1
Turnovers 2 3
Penalties-Yards 5-25 9-54
2011 Florida 33 Tennessee 23
Stat TENN FLA
First Downs 23 17
Rush-Yds-TDs 21–9-0 40-134-1
Comp-Att-Yd-TD-INT 26-48-288-3-2 14-23-213-2-0
Total Yards 279 347
Fumbles-Lost 2-0 1-1
Turnovers 2 1
Penalties-Yards 10-94 16-150
2012 Florida 37 Tennessee 20
Stat FLA TENN
First Downs 20 19
Rush-Yds-TDs 43-336-2 28-83-1
Comp-Att-Yd-TD-INT 14-20-219-2-0 22-44-257-2-2
Total Yards 555 340
Fumbles-Lost 2-0 0-0
Turnovers 0 2
Penalties-Yards 8-78 9-59
2013 Florida 31 Tennessee 17
Stat TENN FLA
First Downs 12 20
Rush-Yds-TDs 23-66-0 56-215-3
Comp-Att-Yd-TD-INT 14-34-154-1-4 11-20-167-1-1
Total Yards 220 382
Fumbles-Lost 2-2 6-2
Turnovers 6 3
Penalties-Yards 3-25 6-44
2014 Florida 10 Tennessee 9
Stat FLA TENN
First Downs 16 12
Rush-Yds-TDs 48-156-1 29-28-0
Comp-Att-Yd-TD-INT 13-27-76-0-3 26-39-205-0-2
Total Yards 232 233
Fumbles-Lost 1-0 2-1
Turnovers 3 3
Penalties-Yards 5-45 8-49
2015 Florida 28 Tennessee 27
Stat TENN FLA
First Downs 20 17
Rush-Yds-TDs 51-254-2 28-109-2
Comp-Att-Yd-TD-INT 12-19-165-1-0 23-43-283-2-1
Total Yards 419 392
Fumbles-Lost 3-1 0-0
Turnovers 1 1
Penalties-Yards 4-25 4-25

Dan Harralson covers Tennessee football for SaturdayDownSouth.com. Follow Dan on Twitter @danharralson.