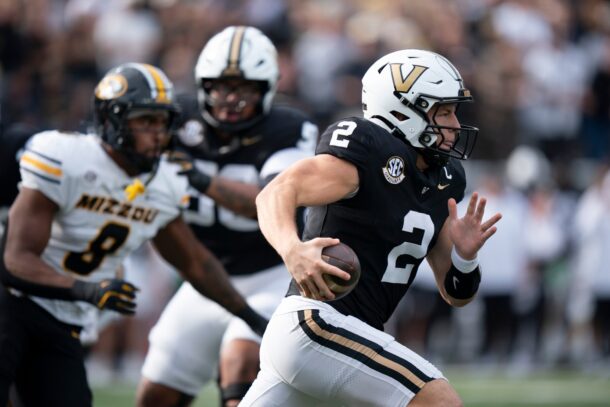
Scoreboards are under assault. Yards are being piled up.
Well, are you not entertained?
The trend in college football, at least as we get set to look at the FBS, fulfills the cries of “we want more” from a scoring and big-play perspective. It begs the question why baseball hasn’t thought of doing the same.
We decided to take a look at exactly how much the trend has grown in the last 10 years, both from the NCAA and SEC angles.
First, we’ll look at the FBS. Keep in mind, the NCAA doesn’t include transitional teams, so I excluded them in the tables below.
| SEASON | NCAA POINTS PER GAME | NCAA YARDS PER GAME | NCAA YARDS PER PLAY |
|---|---|---|---|
| 2006 | 24.4 | 346.9 | 5.42 |
| 2007 | 28.4 | 392.8 | 5.46 |
| 2008 | 27.2 | 371.6 | 5.49 |
| 2009 | 27.0 | 377.5 | 5.58 |
| 2010 | 28.0 | 384.1 | 5.62 |
| 2011 | 28.3 | 392.4 | 5.62 |
| 2012 | 29.5 | 409.2 | 5.73 |
| 2013 | 29.4 | 411.3 | 5.73 |
| 2014 | 29.3 | 409.4 | 5.69 |
| 2015 | 29.7 | 411.6 | 5.76 |
Last season set a new NCAA record with an average of 29.7 points per game, breaking the mark of 29.5 from the 2012 season. We’ve seen a combined average of at least 29 points per game in each of the last four seasons after never approaching that mark previously.
Similarly, a new benchmark was set in total offense at 411.6. The combined average in total yards per game has been at least 400 in the last four seasons after never reaching that level before. The average yards per play of 5.76 is also a new record.
While it looks like a big jump occurred in 2007, that’s not really accurate as the ’06 season was more of an anomaly and just a down year for offenses as a whole.
Now, let’s look at the rushing vs. passing numbers.
| SEASON | NCAA RUSHING YPG | NCAA PASSING YPG |
|---|---|---|
| 2006 | 140.1 | 206.8 |
| 2007 | 159.7 | 233.1 |
| 2008 | 155.0 | 216.5 |
| 2009 | 155.4 | 222.1 |
| 2010 | 162.1 | 221.9 |
| 2011 | 162.7 | 229.7 |
| 2012 | 170.9 | 238.3 |
| 2013 | 174.9 | 236.4 |
| 2014 | 176.0 | 233.4 |
| 2015 | 178.4 | 233.2 |
Take a look at the rushing averages. While the popular theory is that college football is becoming a passing game, that’s not exactly true.
The most consistent trend in this entire story is related to the national rushing yards per game averages, which have seen an increase in each of the last seven years after a decline from 2007-08.
With that said, the average passing yards per game has been at least 230 yards per game in each of the last four seasons. The only other time the NCAA saw that high of an average was in 2007. The all-time high was set in 2012 at 238.3.
Now, let’s zoom in on the trends in the SEC.
| SEASON | SEC POINTS PER GAME | SEC YARDS PER GAME | SEC YARDS PER PLAY |
|---|---|---|---|
| 2006 | 25.4 | 351.6 | 5.72 |
| 2007 | 30.3 | 385.9 | 5.49 |
| 2008 | 25.6 | 342.9 | 5.28 |
| 2009 | 28.4 | 378.5 | 5.73 |
| 2010 | 31.0 | 400.3 | 6.03 |
| 2011 | 27.3 | 354.9 | 5.42 |
| 2012 | 30.4 | 402.4 | 5.92 |
| 2013 | 31.7 | 432.5 | 6.20 |
| 2014 | 31.5 | 417.7 | 5.91 |
| 2015 | 28.4 | 399.6 | 5.77 |
When looking specifically at the best conference in college football, the trend is roughly the same, which has seen an overall uptick of offense over the last four seasons.
Over that span, SEC teams are posting an average of 30.5 points per game, while the league averaged almost exactly 28 points per game over the previous six seasons.
In terms of yardage, if we’re generous and just consider 399.6 to be 400, the conference has spent five of the last six seasons averaging at least 400 yards or more a game after never doing so previously.
Here’s a look at the rushing and passing numbers.
| SEASON | SEC RUSHING YPG | SEC PASSING YPG |
|---|---|---|
| 2006 | 140.5 | 211.1 |
| 2007 | 168.4 | 217.5 |
| 2008 | 147.1 | 195.8 |
| 2009 | 175.6 | 202.9 |
| 2010 | 175.4 | 224.9 |
| 2011 | 161.1 | 193.9 |
| 2012 | 168.4 | 234.0 |
| 2013 | 196.9 | 235.5 |
| 2014 | 188.9 | 228.7 |
| 2015 | 177.2 | 222.4 |
As a whole, there doesn’t seem to be a clear-cut trend on the rushing side of things. However, the surprising thing is that the SEC has definitely increased its passing output in the last four seasons (like the rest of the NCAA), but it hasn’t followed the same consistent, upward trend as the rest of the country.
Of course, take these numbers with a grain of salt as this is an overhead view of both the NCAA and the SEC. If we looked on a more team-by-team basis, we’d find that some teams are conforming to some trends while reverting to others.
However, there’s no doubt about the steady increase in points being scored and yardage being racked up. The SEC, more or less, is part of the progression.
Born and raised in Gainesville, Talal joined SDS in 2015 after spending 2 years in Bristol as an ESPN researcher. Previously, Talal worked at The Gainesville Sun.


