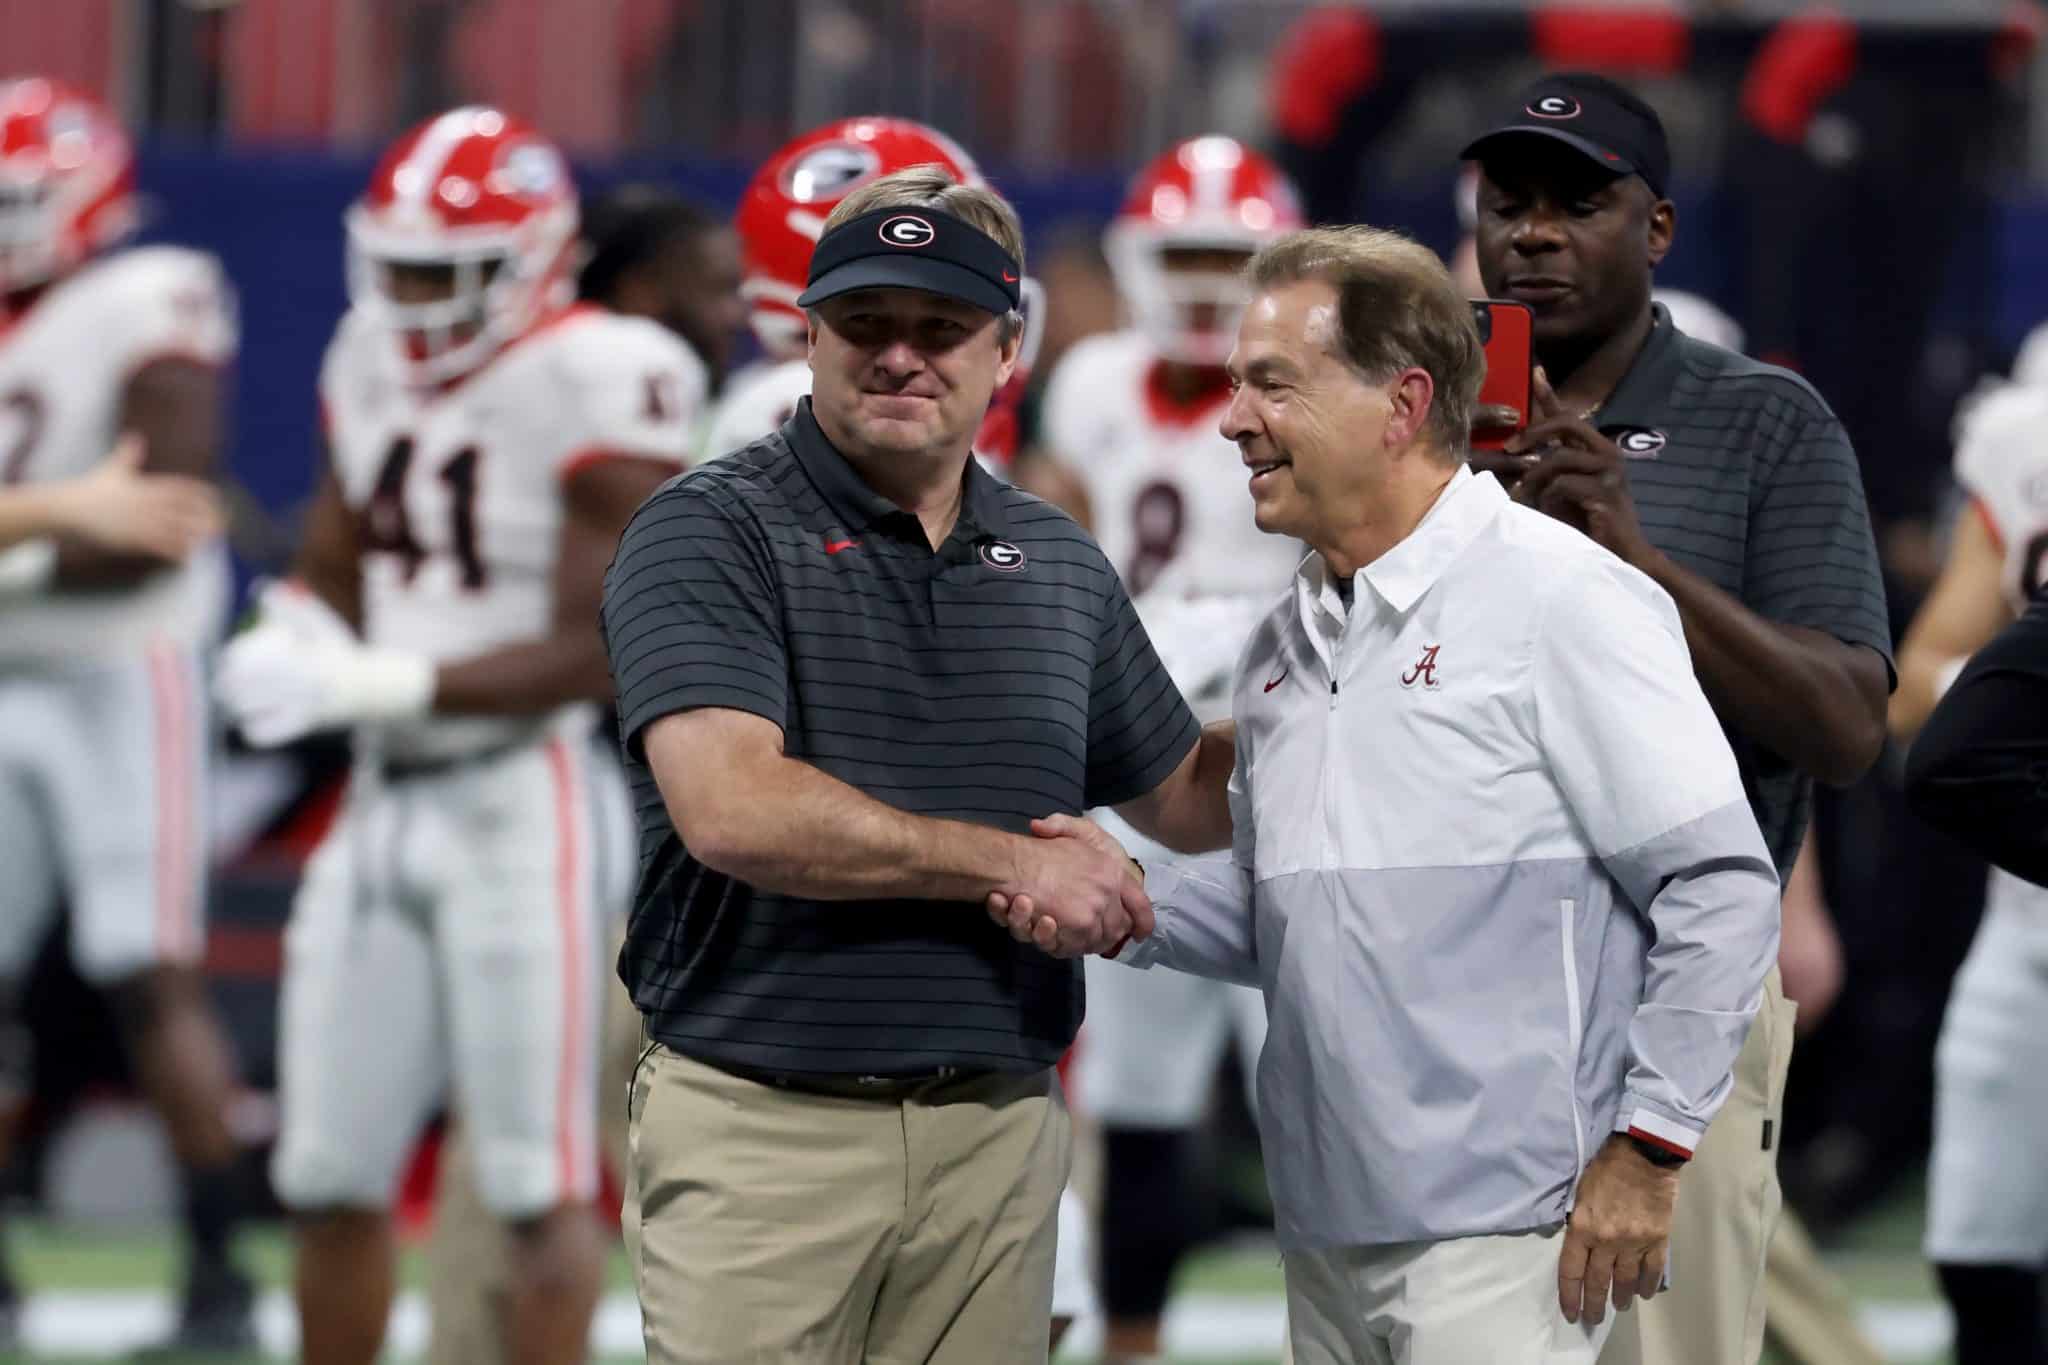
Alabama vs. Georgia will headline conference championship weekend as the 2 programs meet in Atlanta for the SEC title on Saturday.
This is a rematch of the 2021 SEC Championship Game, which saw Alabama win 41-24. However, the Bulldogs have not lost since falling to the Tide that night. They’ve rattled off 29 consecutive wins, including each of the past 2 national championships.
Both of these programs, of course, have elite statistical profiles. However, both teams also have some surprising weaknesses that could impact their national title hopes in 2023 — and the outcome of this game.
Let’s examine some betting trends, advanced stats and other useful info about these teams:
Alabama vs. Georgia Betting Lines
Spread: Georgia -6.5 (DraftKings)
Total: Over/under 54.5 points (DraftKings)
Check out these top sports betting apps to get in on the fun ahead of Saturday’s SEC Championship Game.
Betting trends to know for Alabama
- Alabama is 8-4 against the spread this season
- The over is 9-3 in Alabama games this season
- This is the first time Alabama has been an underdog this year
Here’s an interesting note: Alabama and Georgia have played 5 times since Kirby Smart left the Tide’s coaching staff to take the head job in Athens. UGA has only won 1 of those games straight up, but the Bulldogs and Tide are knotted up at 2-2-1 against the spread in those matchups.
Betting trends to know for Georgia
- Georgia is 4-7-1 against the spread this season
- The over is 6-6 in Georgia games this season
- Georgia is 4-2 against the spread when favored by 14.5 points or fewer
This is the first time all season that Georgia has been favored by under a touchdown. The Bulldogs got off to an awful start this season against the spread, but have picked up over the course of the year as their schedule got tougher. For the most part, Georgia has stepped up when Vegas projected its game to be decided by 2 scores or less. It will be interesting to see if that trend continues vs. the Crimson Tide.
Résumé rankings
Via ESPN’s Football Power Index:
- Alabama strength of schedule: 31st
- Georgia strength of schedule: 59th
- Alabama strength of record: 7th
- Georgia strength of record: 4th
Advanced Stats preview
Success rate will be the primary tool referenced in this section. Whether or not a play is “successful” depends on the down and distance of a given play. Here’s a breakdown of how much yardage is necessary for a play to be deemed “successful”:
- 1st down: Teams must gain at least 50% of required yardage
- 2nd down: Teams must gain at least 70% of required yardage
- 3rd or 4th down: Teams must gain 100% of required yardage
Defensively, numbers are presented as what the defense allowed the offense to achieve. So on defense, a 35% success rate is better than a 40% success rate.
Let’s dig into what success rate says about this matchup:
Rushing Success Rate
- Alabama rushing offense success rate: 45% (67th percentile)
- Georgia rushing defense success rate: 45% (33rd percentile)
A couple of weeks ago, Georgia’s rush defense was in the 55th percentile, which I flagged as a potential concern for the Bulldogs’ 3-peat hopes. Since then, it’s only gotten worse. Georgia’s run defense has dipped from a 42% success rate to 45% success rate over its last 2 games against Tennessee and Georgia Tech. It’s worth noting that Georgia has only faced 355 rushing attempts through 12 games — by far the lowest total of any SEC program. That’s likely because teams are usually playing catch-up against the Bulldogs and are forced to throw the ball more often late in games. Still, with a rushing defense success rate in the 33rd percentile, teams should be putting more stress on UGA in that area.
Fortunately for Georgia, Alabama’s rushing offense might not be enough of a strength to really expose the Bulldogs. Alabama has rushed for more than 5 yards per carry in just 3 games this season. The opponents in those matchups were Middle Tennessee State, LSU and Chattanooga. LSU is only slightly worse against the run (from a success rate perspective) than Georgia is, but the Bulldogs are much more resistant to explosive plays. Alabama will have to find a way to break through with its running game if it wants to pull off the upset.
- Georgia rushing offense success rate: 51% (95th percentile)
- Alabama rushing defense success rate: 38% (79th percentile)
Georgia’s running game has had no issues gouging teams this season, most recently last weekend when it went for 262 yards on 39 carries vs. Georgia Tech. Alabama’s defensive front does pose some different challenges than UGA saw vs. the Yellow Jackets, however.
Alabama’s rush defense ranks No. 4 in the SEC on a yards-per-carry basis. UGA has faced 2 other top-5 SEC rush defenses this season in Tennessee (No. 1) and Mizzou (No. 5). Both the Vols and Tigers held Georgia to under 4 yards per attempt on the ground.
Passing Success Rate
- Alabama passing offense success rate: 45% (75th percentile)
- Georgia passing defense success rate: 33% (97th percentile)
Jalen Milroe has become an exceptionally efficient passer, albeit on relatively low volume. Milroe has averaged more than 10 yards per attempt in 5 of his last 6 games. Alabama only throws the ball 42.7% of the time (excluding garbage time), but this has become a strength for the Crimson Tide over the second half of the season.
While Georgia isn’t stout against the run, it has one of the best pass defenses in the country on a down-to-down basis. Only one team all season (South Carolina) has thrown for more than 250 yards on the Bulldogs. Georgia has more interceptions (12) than passing touchdowns allowed (11). In fact, the Bulldogs haven’t allowed a passing TD at all since Nov. 4.
- Georgia passing offense success rate: 54% (98th percentile)
- Alabama pass defense success rate: 33% (98th percentile)
This is elite-on-elite. Georgia’s passing offense has been elite pretty much across the board, including in passing down situations. The Bulldogs have a success rate of 45% on passing downs this season, which is in the 100th percentile nationally.
Alabama’s pass defense has been great overall, but the Crimson Tide have been vulnerable to strong passing attacks at times this year. Alabama gave up big performances to Texas (349 yards on 38 attempts), LSU (272 yards on 34 attempts) and Texas A&M (239 yards on 25 attempts). Ole Miss and Tennessee also threw for 240+ yards on the Tide, although those outputs were relatively inefficient. Georgia has posted the 3rd best passer efficiency rating of any SEC team this season (behind LSU and Alabama) so it will be interesting to see if the Tide can meet that challenge.
Havoc rate
A havoc play is defined as a play where the defense records a tackle for loss, a forced fumble, an interception or a pass breakup.
For defenses, a higher havoc rate is good. Offensively, havoc rates are presented as what the offense allowed the defense to create. On that side of the ball, the lower the havoc rate, the better it is for your offense.
Here’s a breakdown of this matchup:
- Alabama offensive havoc rate: 15% (71st percentile)
- Georgia defensive havoc rate: 17% (50th percentile)
Georgia’s defense has never relied on havoc but has still consistently been able to produce elite results. The Bulldogs are elite at getting off the field once you’re behind the chains. Georgia’s defense has posted a success rate of 24% on passing downs this season, which is in the 95th percentile nationally. Georgia has allowed a 3rd down conversion rate of 26.67%, which is good enough for No. 1 in the SEC in 2023.
For Alabama’s offense, the Crimson Tide have done a great job of taking care of the ball this season. Alabama only has 10 giveaways all year, which is tied for 10th nationally. The Tide have been somewhat vulnerable with regards to giving up tackles for loss. The Tide have conceded 70 TFLs this season, which is the bottom half of all SEC programs.
- Georgia offensive havoc rate: 12% (94th percentile)
- Alabama defensive havoc rate: 19% (79th percentile)
Georgia is 2nd in the SEC and 11th nationally in fewest tackles for loss allowed with 47.
Points per opportunity
A scoring “opportunity” is defined as a possession in which the offense has moved the ball beyond the opponents’ 40-yard line. This stat measures how effective a team is at cashing on its scoring chances — or preventing them from their opponents.
- Alabama points scored per opportunity: 4.66 (86th percentile)
- Georgia points allowed per opportunity: 3.54 (64th percentile)
Both teams have been pretty good in this area, but Alabama has been more efficient. The Tide have scored on 42-of-45 red zone attempts this season, which is the second-highest mark in the SEC in 2023. Alabama also has the second-best touchdown percentage on red zone attempts (71.1%) among SEC teams.
Georgia’s defense specializes in keeping opposing teams out of scoring opportunities rather than limiting them once they’re there. The Bulldogs faced only 30 red zone possessions this season, which ranks No. 1 in the SEC and is tied for 11th nationally.
- Georgia points scored per opportunity: 4.94 (97th percentile)
- Alabama points allowed per opportunity: 3.77 (51st percentile)
This is a pretty big edge for Georgia. The Bulldogs are tied with LSU for the SEC lead in most red zone touchdowns this season with 45. UGA has scored on 91.18% of its red zone possessions so far this season.
Like Georgia, Alabama’s defense excels at limiting scoring opportunities. But the Tide have been mediocre defensively once opponents cross the 40-yard line. Alabama is 3rd in the SEC in opponent red zone attempts (33) in 2023.
Tracking efficiency
- Alabama offense: 19th
- Alabama defense: 8th
- Alabama special teams: 28th
- Georgia offense: 4th
- Georgia defense: 15th
- Georgia special teams: 61st
- Alabama offense: 13th
- Alabama defense: 8th
- Alabama special teams: 4th
- Georgia offense: 4th
- Georgia defense: 5th
- Georgia special teams: 2nd
Note: All advanced stats mentioned in this story are from CollegeFootballData.com unless otherwise noted. Betting trends are via the Sports Betting Dime database.
Spenser is a news editor for Saturday Down South and covers college football across all Saturday Football brands.


