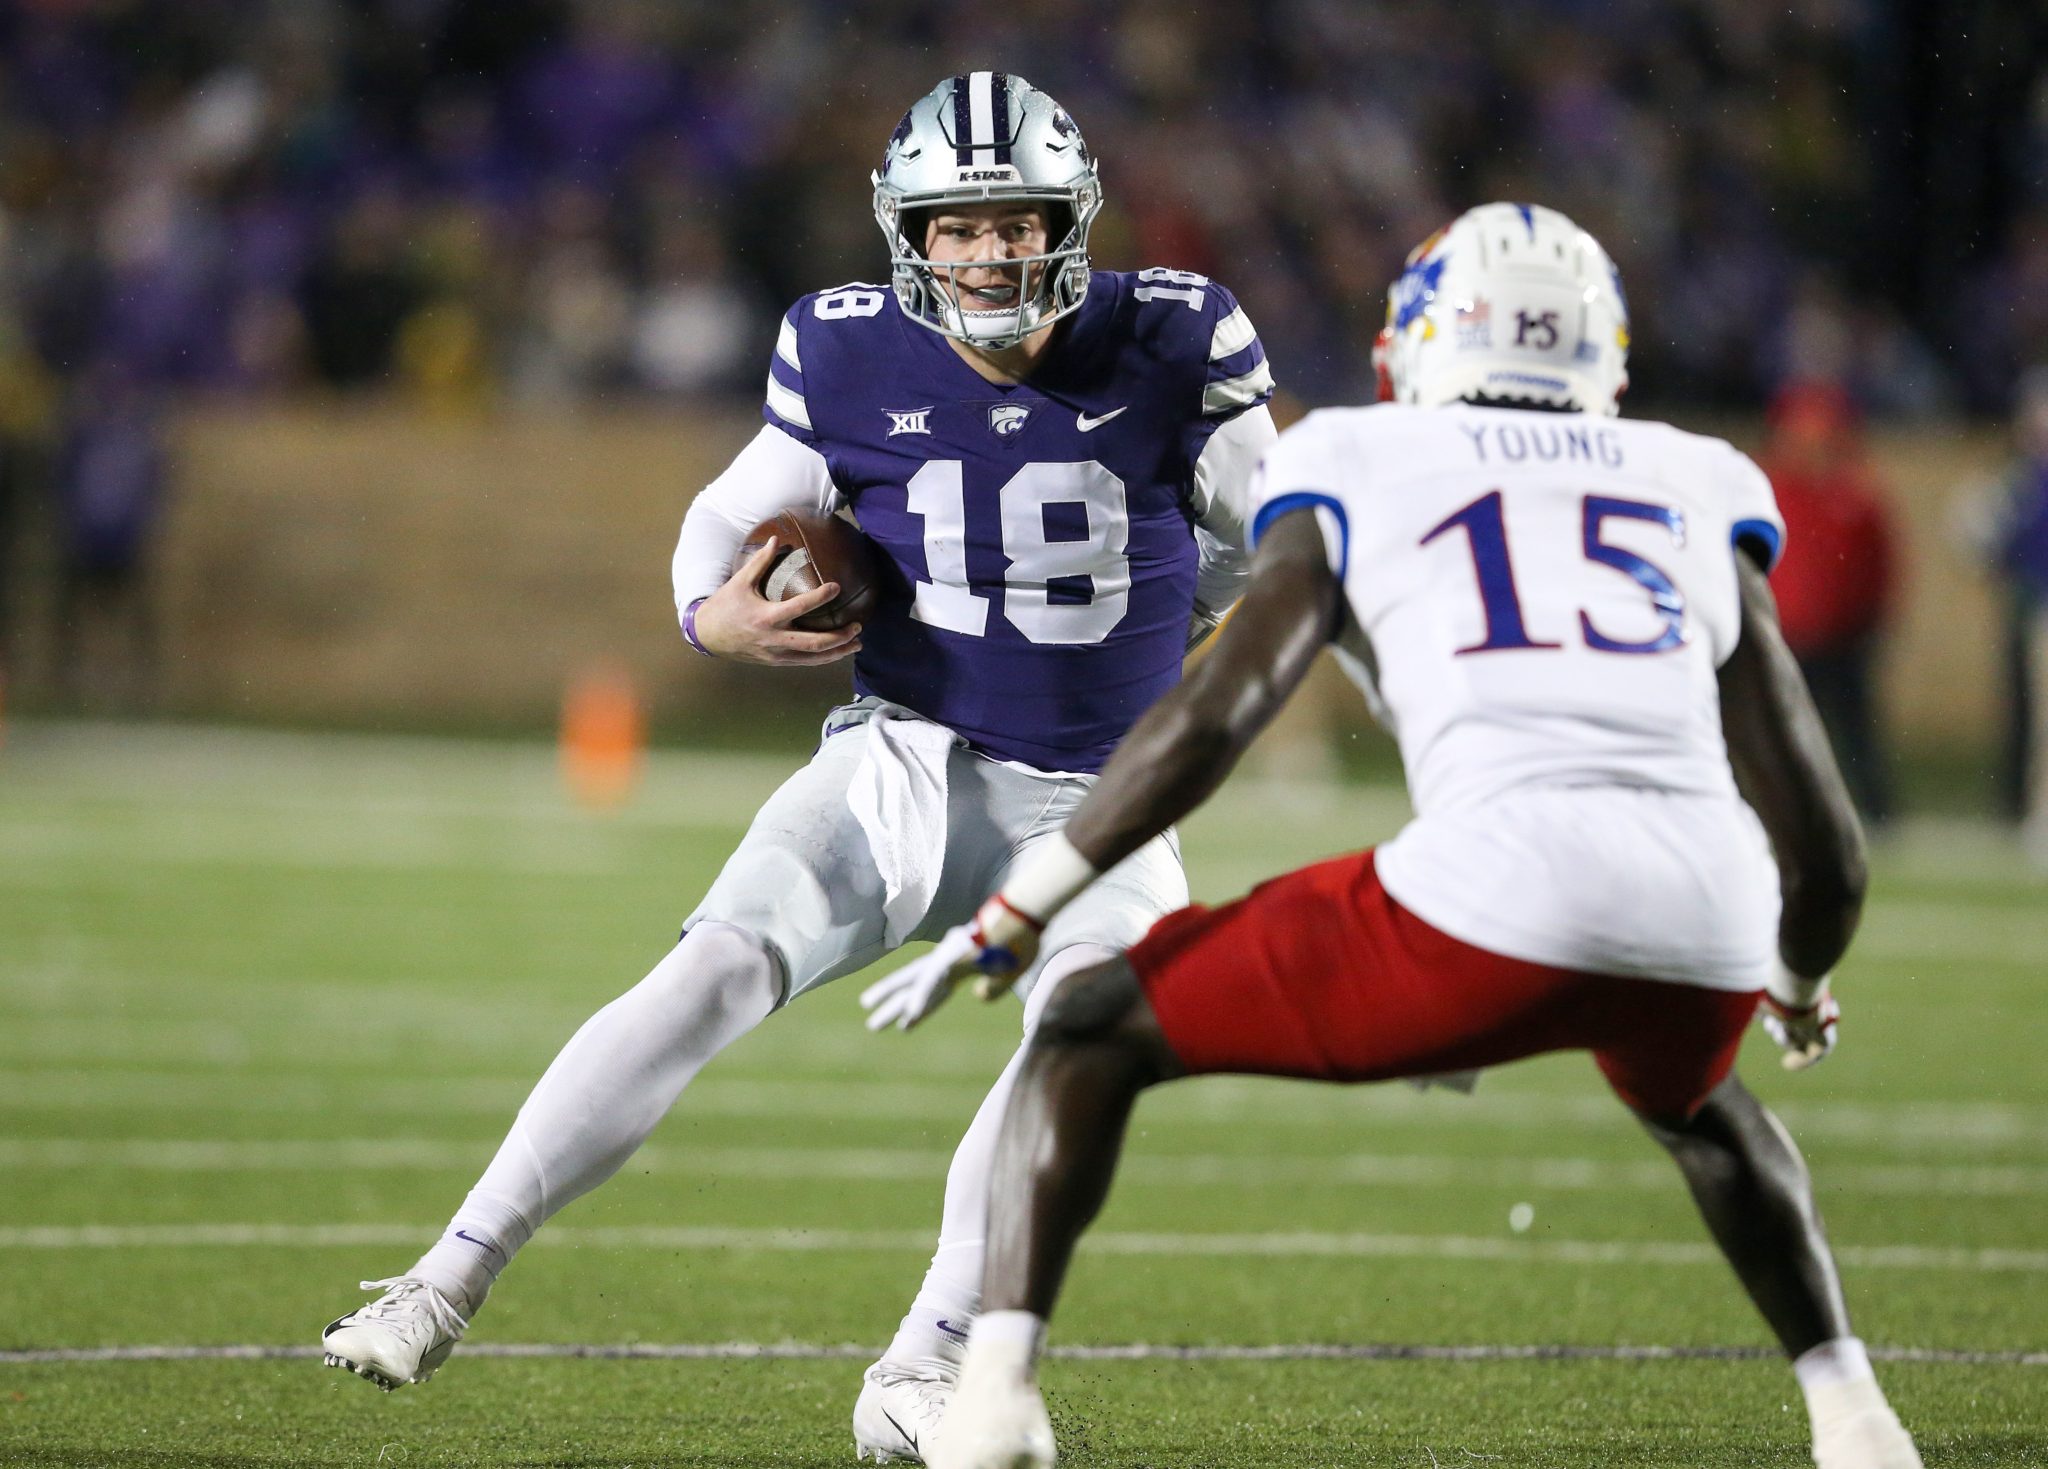
Kansas State vs. Kansas is a rivalry game with more stakes than usual as both teams reside in the top 25 this week.
The Wildcats, who have won 14 games in a row in this series, are still alive in the race for a Big 12 Championship Game berth. But at 5-2, K-State will need a win over its in-state rival to keep hope of reaching the conference title game alive.
Both of these programs have strong statistical profiles offensively. However, the Kansas defense has shown to be less consistent so far this season and could be what separates these teams on Saturday.
Let’s examine some betting trends, advanced stats and other useful info about these teams:
Kansas State vs. Kansas Betting Lines
Spread: Kansas State -9.5 (DraftKings)
Total: 57.5 (DraftKings)
Check out these sports betting apps to get in on the action ahead of Saturday’s Big 12 rivalry game.
Betting trends to know for Kansas State
- Kansas State is 8-2 against the spread this season
- K-State has covered 5 games in a row
- The over is 6-4 in Kansas State games this season
- Kansas State is 2-2 against the spread on the road this season
- Kansas State is 6-2 against the spread as the favorite this season
Kansas State has been a covering machine lately. The last time it lost ATS was back on Oct. 6 against Oklahoma State. There’s also this — Kansas State is 4-0 against the spread against Kansas during the Chris Klieman era.
Betting trends to know for Kansas
- Kansas is 5-5 against the spread this season
- The over is 5-4-1 in Kansas games this season
- Kansas is 4-2 against the spread in home games this season
- Kansas is 3-1 against the spread as the underdog this season
Overall, Kansas’ ATS performance has been mediocre this season. But in this spot specifically — as a home underdog — the Jayhawks are 2-0 on the year. The Jayhawks won both of those games outright against Oklahoma and UCF.
Résumé rankings
Via ESPN’s Football Power Index:
- Kansas State strength of schedule: 33rd
- Kansas strength of schedule: 34th
- Kansas State strength of record: 23rd
- Kansas strength of record: 25th
Advanced Stats preview
Success rate will be the primary tool referenced in this section. Whether or not a play is “successful” depends on the down and distance of a given play. Here’s a breakdown of how much yardage is necessary for a play to be deemed “successful”:
- 1st down: Teams must gain at least 50% of required yardage
- 2nd down: Teams must gain at least 70% of required yardage
- 3rd or 4th down: Teams must gain 100% of required yardage
Defensively, numbers are presented as what the defense allowed the offense to achieve. So on defense, a 35% success rate is better than a 40% success rate.
Let’s dig into what success rate says about this matchup:
Rushing Success Rate
- Kansas State rushing offense success rate: 50% (91st percentile)
- Kansas rushing defense success rate: 45% (38th percentile)
With the notable exception of the Texas game (29 yards on 30 carries), Kansas State has been an excellent rushing offense this season. The Wildcats are averaging 5 yards per carry and have frequently gone over that benchmark vs. Big 12 competition. Kansas’s rushing defense, however, leaves a lot to be desired. Given how often K-State runs the ball (over 55% of the time), this could be a big edge for the Wildcats.
- Kansas rushing offense success rate: 48% (84th percentile)
- Kansas State rushing defense success rate: 37% (86th percentile)
This looks like 2 pretty even units. The Jayhawks run it even more than the Wildcats do (60.6% of the time), which could put a lot of stress on K-State’s rushing defense. If one team can impose its will in this area, it could have a big impact on the game.
Passing Success Rate
- Kansas State passing offense success rate: 47% (82nd percentile)
- Kansas passing defense success rate: 45% (14th percentile)
This is another big edge for Kansas State’s offense. The Jayhawks’ defense has struggled mightily this season, especially in the passing game. After being too turnover-prone early in the year, Will Howard has thrown just 1 interception in his last 5 games. He’s also thrown 12 touchdowns while leading Kansas State to a 4-1 record over that span.
KU’s pass defense has allowed opponents to complete 68.5% of its passes this season — the worst mark in the Big 12. They do a decent job of limiting explosive plays, but that’s not really K-State’s game anyway.
- Kansas passing offense success rate: 49% (89th percentile)
- Kansas State pass defense success rate: 38% (78th percentile)
Despite not having Jalon Daniels since Week 4, Kansas’s passing offense has been very good this season. Jason Bean has done a great job as KU’s backup in 2023. Bean did suffer an injury last weekend against Texas Tech but is expected to play this weekend. It’s worth checking up on his status prior to kickoff, though. If Bean can’t go, it would be true freshman Cole Ballard who likely gets the start.
Havoc rate
A havoc play is defined as a play where the defense records a tackle for loss, a forced fumble, an interception or a pass breakup.
For defenses, a higher havoc rate is good. Offensively, havoc rates are presented as what the offense allowed the defense to create. On that side of the ball, the lower the havoc rate, the better it is for your offense.
Here’s a breakdown of this matchup:
- Kansas State offensive havoc rate: 12% (93rd percentile)
- Kansas defensive havoc rate: 17% (49th percentile)
Kansas State has done a great job of limiting havoc this season. K-State doesn’t allow many tackles for loss and it has only had 10 giveaways all season, which is good enough for 2nd in the Big 12. Any big plays Kansas’s defense can make on Saturday would be a bonus for the Jayhawks.
- Kansas State defensive havoc rate: 18% (68th percentile)
- Kansas offensive havoc rate: 13% (88th percentile)
Like the Wildcats, the Jayhawks have done a great job of limiting havoc plays offensively this season. Kansas State’s defense is a little better in that regard, however. The Wildcats are tied for 3rd in the Big 12 with 17 takeaways so far in 2023.
Points per opportunity
A scoring “opportunity” is defined as a possession in which the offense has moved the ball beyond the opponents’ 40-yard line. This stat measures how effective a team is at cashing on its scoring chances — or preventing them from their opponents.
- Kansas State points scored per opportunity: 5.07 (97th percentile)
- Kansas points allowed per opportunity: 4.10 (26th percentile)
It’s tough to get much better than Kansas State has been when it comes to cashing in on scoring opportunities. The Wildcats are elite in this regard and they’re facing a KU defense that has not provided much resistance in those spots this season. Kansas State scores touchdowns, not field goals, in the red zone. In 50 red zone possessions this season, K-State has 40 touchdowns and 5 field goals. That 80% touchdown rate is 4th nationally.
- Kansas points scored per opportunity: 4.17 (69th percentile)
- Kansas State points allowed per opportunity: 2.86 (92nd percentile)
This is another area where K-State shines. The Wildcats’ defense allows a touchdown only 37% of their red zone possessions. That’s incredible and, once again, ranks 4th nationally. K-State has allowed more red zone field goals (12) than it has touchdowns (10) this season.
Tracking efficiency
- Kansas State offense: 14th
- Kansas State defense: 11th
- Kansas State special teams: 90th
- Kansas offense: 16th
- Kansas defense: 56th
- Kansas special teams: 82nd
- Kansas State offense: 10th
- Kansas State defense: 27th
- Kansas State special teams: 67th
- Kansas offense: 25th
- Kansas defense: 64th
- Kansas special teams: 55th
Note: All advanced stats mentioned in this story are from CollegeFootballData.com unless otherwise noted. Betting trends are via the Sports Betting Dime database.
Spenser is a news editor for Saturday Down South and covers college football across all Saturday Football brands.


