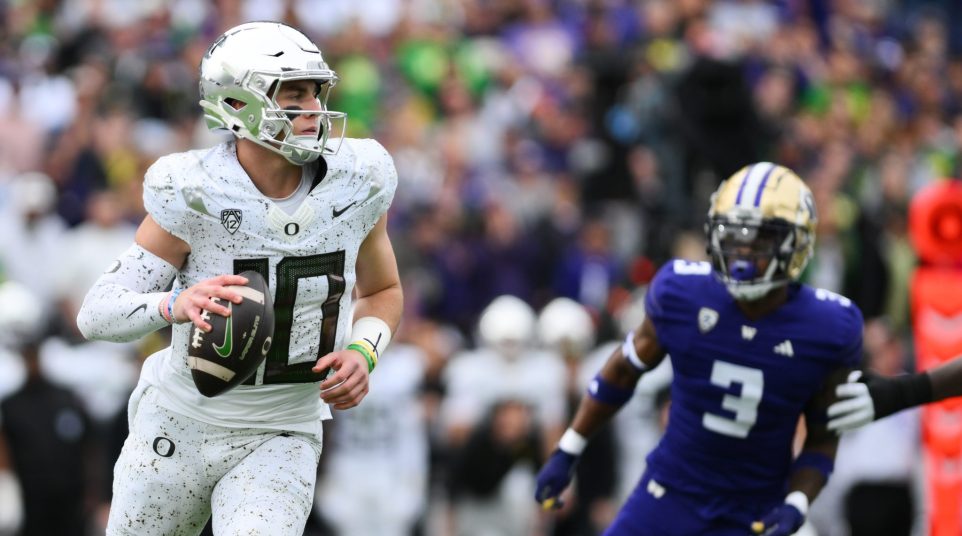
Oregon vs. Washington preview: Betting trends, advanced stats analysis for Pac-12 Championship Game
Oregon vs. Washington is shaping up to be a de-facto Playoff game, with the winner likely to be included in the College Football Playoff top 4 on Sunday.
Washington enters this game with an undefeated record, but may have peaked too soon. Oregon has been surging since its loss to Washington on Oct. 14 and is a big favorite in this neutral-site rematch.
The statistical profiles for these teams are fascinating. Oregon looks to be an elite squad with very few actionable weaknesses. Washington’s defense, however, is something that can be exposed in a big game like this. There’s also reason to be concerned about Washington’s offense going into this matchup with the Ducks (more on that later).
Let’s examine some betting trends, advanced stats and other useful info about these teams:
Oregon vs. Washington Betting Lines
Spread: Oregon -9.5 (DraftKings)
Total: Over/under 65.5 points (DraftKings)
Check out these great sports betting apps to get in on the action ahead of Friday’s Pac-12 title game.
-
1

-
2

-
3

-
4

-
5

-
6

Betting trends to know for Oregon
- Oregon is 9-2-1 against the spread this season
- The over is 5-6-1 in Oregon games this season
- Oregon is 9-2 against the spread this season as the favorite
- Oregon is 3-0 against the spread this season when favored by 14 points or less
Oregon has been one of the most profitable teams to back in the entire country this season. The Ducks have only been underdogs once (against Washington) and have cashed at an incredible rate during their 11 games as the favorite. Oregon is also undefeated this season (3-0) when favored by 2 touchdowns or less. Oregon will be playing a neutral-site game this weekend against the Huskies, but the Ducks are also 4-0-1 ATS this year away from Eugene.
Betting trends to know for Washington
- Washington is 5-6-1 against the spread this season
- The over is 6-6 in Washington games this season
- The total in Washington’s first game vs. Oregon this season went over
- Washington is 2-5-1 ATS in its last 8 games
- Washington is 1-0 ATS and 1-0 straight up as the underdog
While Oregon has been one of the best teams to back as a bettor, Washington has been mediocre-to-poor. That’s been especially true since Washington’s hot-start in September. The Huskies have only covered 2 of their last 8 games after starting the year with a 3-1 record against the spread. One of those wins was against USC, who went 3-9 ATS this season and is among the worst teams in the country against the number.
Résumé rankings
Via ESPN’s Football Power Index:
- Oregon strength of schedule: 62nd
- Washington strength of schedule: 46th
- Oregon strength of record: 9th
- Washington strength of record: 2nd
Advanced Stats preview
Success rate will be the primary tool referenced in this section. Whether or not a play is “successful” depends on the down and distance of a given play. Here’s a breakdown of how much yardage is necessary for a play to be deemed “successful”:
- 1st down: Teams must gain at least 50% of required yardage
- 2nd down: Teams must gain at least 70% of required yardage
- 3rd or 4th down: Teams must gain 100% of required yardage
Defensively, numbers are presented as what the defense allowed the offense to achieve. So on defense, a 35% success rate is better than a 40% success rate.
Let’s dig into what success rate says about this matchup:
Rushing Success Rate
- Oregon rushing offense success rate: 58% (99th percentile)
- Washington rushing defense success rate: 51% (4th percentile)
If you’re wondering why Oregon is favored by nearly 10 points despite losing to Washington on the road earlier this season, look no further than this stat. Matchup advantages don’t get much more drastic than this on conference championship weekend.
Oregon figures to be able to run the ball at-will while the Huskies have struggled vs. the run on a down-to-down basis for most of the last 2 months. If there’s one saving grace for the Huskies in this matchup, it’s that they have been relatively resistant to big plays. Still, if Oregon can stay ahead of the chains, whether or not the Ducks can generate big plays on the ground shouldn’t matter too much.
- Washington rushing offense success rate: 54% (98th percentile)
- Oregon rushing defense success rate: 37% (83rd percentile)
This is a much more even matchup. The first time these teams met this year, Washington’s rushing attack largely won the battle. The Huskies posted a rushing success rate of 50% in that contest as Dillon Johnson carried the ball 20 times for 100 yards and 1 touchdown. However, Washington only had 23 total rush attempts compared to 38 pass attempts in that meeting. With Michael Penix Jr. rumored to be dealing with some sort of injury, leaning on the run game more could be a viable strategy for the Huskies.
Passing Success Rate
- Oregon passing offense success rate: 58% (100th percentile)
- Washington passing defense success rate: 40% (68th percentile)
You could make the case that Oregon had the best passing offense in the country this season. The Ducks’ success rate of 58% didn’t quite live up to that standard in their first meeting with Washington, however. Oregon posted a passing success rate of 49% in that contest — still an impressive figure but not nearly as elite as the 58% mark for the 2023 season. Washington’s defense has been considerably better vs. the pass this season than against the run, but the Huskies are still vulnerable here.
- Washington passing offense success rate: 53% (96th percentile)
- Oregon pass defense success rate: 37% (88th percentile)
The last time these teams played, Washington won the battle with a passing success rate of 51%. However, with Penix’s rumored injury, it could be hard for the Huskies to replicate that performance. Through 10 weeks, Washington had a passing success rate north of 57%. In its last 3 games, it has posted a passing success rate of just over 40%. Is the Penix injury to blame for the decrease in efficiency or have opposing defenses figured out a way to defend Washington more effectively? Either way, that’s a significant-enough drop-off to cause real concern ahead of this matchup against an Oregon pass defense that has generally been solid in 2023.
Havoc rate
A havoc play is defined as a play where the defense records a tackle for loss, a forced fumble, an interception or a pass breakup.
For defenses, a higher havoc rate is good. Offensively, havoc rates are presented as what the offense allowed the defense to create. On that side of the ball, the lower the havoc rate, the better it is for your offense.
Here’s a breakdown of this matchup:
- Oregon offensive havoc rate: 8% (99th percentile)
- Washington defensive havoc rate: 15% (25th percentile)
This shouldn’t be too much of a surprise, given the success rate numbers for Oregon’s offense and Washington’s defense. Even still, an 8% havoc rate for Oregon’s offense is borderline unsustainable. The Ducks have allowed only 5 sacks all season. They also lead the Pac-12 in fewest tackles for loss allowed and giveaways.
Washington’s defense doesn’t create much havoc on the other side. The Huskies have only forced 5 fumbles all season and are near the bottom of the league in tackles for loss as well. The one area the Huskies do excel with creating havoc is in the secondary. Washington leads the Pac-12 with 15 interceptions and 69 passes defended on the season. Unfortunately for Washington, it is facing a quarterback in Bo Nix who has completed 78.6% of his passes and has a 37-to-2 TD-to-INT ratio this season.
- Washington offensive havoc rate: 13% (91st percentile)
- Oregon defensive havoc rate: 18% (65th percentile)
Like Oregon, Washington has done a good job of limiting havoc this season. Washington is 2nd in the conference (behind Oregon) in tackles for loss allowed. Oregon has been effective defensively without an elite havoc rate. That’s in large part due to the Ducks’ ability to get off the field on 3rd down. Their opponent 3rd down conversion rate is just 32.32%, which is good enough for 2nd amongst Pac-12 teams.
Points per opportunity
A scoring “opportunity” is defined as a possession in which the offense has moved the ball beyond the opponents’ 40-yard line. This stat measures how effective a team is at cashing on its scoring chances — or preventing them from their opponents.
- Oregon points scored per opportunity: 5.07 (99th percentile)
- Washington points allowed per opportunity: 3.81 (49th percentile)
Surprise, surprise — another area where Oregon’s offense is ruthlessly efficient and where Washington’s defense is frustratingly mediocre. Oregon leads the Pac-12 in red zone attempts, red zone scores and red zone touchdowns. The Ducks don’t kick field goals in the red zone very often, either — only 7 all season on 63 such possessions. Oregon also leads the Pac-12 with 15 4th-down conversions this season — although it had a couple of high-profile misses in its loss to Washington earlier this season.
- Washington points scored per opportunity: 4.78 (91st percentile)
- Oregon points allowed per opportunity: 3.21 (86th percentile)
This is a much more compelling matchup. Remember Washington’s significant dip in passing success rate over its past 3 games? That hasn’t had much of an impact on the Huskies’ efficiency on scoring opportunities. They’re still averaging 4.39 points per scoring chance over that span (on 18 total chances).
Defensively, Oregon has forced 10 red zone field goals this season — a FG rate of 29.41%, which is the 2nd-highest mark in the Pac-12. That has helped the Ducks keep opposing offenses to just over 3 points per scoring opportunity this season.
Tracking efficiency
- Oregon offense: 2nd
- Oregon defense: 14th
- Oregon special teams: 124th
- Washington offense: 5th
- Washington defense: 32nd
- Washington special teams: 24th
- Oregon offense: 1st
- Oregon defense: 14th
- Oregon special teams: 91st
- Washington offense: 5th
- Washington defense: 42nd
- Washington special teams: 91st
Note: All advanced stats mentioned in this story are from CollegeFootballData.com unless otherwise noted. Betting trends are via the Sports Betting Dime database.